Work

From the data pipeline behind a six person machine learning project and a prototype built with an industry partner to a road safety study and dashboards built for practice, with the most relevant work first. Where there is something to look at, the link goes straight to the case study, the repository or the live dashboard.

Domain adaptive sentiment analysis

Six person team project, Swinburne, 2026. My role: data engineer.

A sentiment model that had to work across two very different kinds of writing: casual Reddit comments and formal financial reporting. I owned the data side: pulling in GoEmotions and the Financial PhraseBank, writing the cleaning and standardisation steps so both corpora came out in a consistent shape, and producing the train, validation and test splits the modelling work ran on.

The team used those splits to fine-tune BERT (bert-base-uncased) in three ways, and built a Streamlit dashboard that displayed the metrics.

When one model scored 98.9% against a field near 85%, the cause was in the data: test sentences had leaked into the combined training file. Rebuilt from training rows only, it scored 84.7%, in line with everything else.

Tools Python, pandas, Hugging Face, BERT

One pipeline for two kinds of writing
  1. Two sourcesReddit comments (GoEmotions) and financial news sentences (Financial PhraseBank)
  2. One cleaning pipelineBoth corpora come out in the same shape
  3. Train, validation and test splitsFixed before any modelling started
  4. BERT fine-tuningMetrics shown in a Streamlit dashboard

OSHC When It Matters

Team project, Swinburne (COS70008), 2026. Industry partner: Medibank. My part: extraction, arithmetic and evaluation.

A learning prototype that helps international students make sense of their Overseas Student Health Cover: short sourced lessons, practical steps for finding care, a bill explainer that works on synthetic invoices, and a guarded chat. The chat was the hard part. Every answer goes through an input review, a grounded draft and an output audit, and its citations are checked against the source PDF.

My part was the bill explainer's extraction, the benefit and MBS arithmetic, the question classifier and the evaluation code. The arithmetic had its tests written before the code, because it is money. We also designed the evaluation so that nobody builds against the held-out set they are scored on.

Tools Python, Streamlit, Claude Haiku (Anthropic API), pytest

No answer is released until it passes three checks
  1. Student asks a questionPersonal details are screened out
  2. Input review
  3. Grounded draftWritten from the source guide
  4. Output auditCitations checked against the source PDF
  5. Cited answer released

If any step fails, the student gets a fixed abstention, not a guess.

Vehicle weight and driver injury in two-car crashes

Team of two, Swinburne (COS80023 Big Data), 2026. My part: building the data, the models and the figures.

When two cars collide, how much does weight decide which driver is killed or seriously injured? We compared the two drivers inside each of 57,217 Victorian crashes, so the road, the weather and the speed limit cancel out. After adjusting for driver age and sex, vehicle age, seatbelt use and point of impact, each 10% of extra weight went with about 20% lower odds for that car's driver.

The plan said to model weight per 100 kg. I tested that straight line before trusting it, found it understated the risk for light cars, and switched to the ratio of the two weights. The confounder we expected was vehicle age. It turned out to be driver sex.

Tools R, survival (conditional logistic regression), dplyr, ggplot2

If the other car is 50% heavier, your odds are 2.6 times that driver's

Odds of being killed or seriously injured for the lighter car's driver, compared with the driver of the heavier car.

Fitted from 57,217 Victorian crashes, adjusted for driver age and sex, vehicle age, seatbelt use and point of impact.

More work

Bank loan portfolio dashboard

Personal project.

I loaded a bank loan dataset into MS SQL Server and wrote the queries behind the headline numbers: total applications, funded amount, average interest rate and the month on month movement, using DATEPART, CTEs and window functions. Loans were split into performing and non performing, and the results went into three linked Tableau dashboards covering the summary, the monthly and regional view, and a detail table. Every figure on the dashboards was checked back against the SQL.
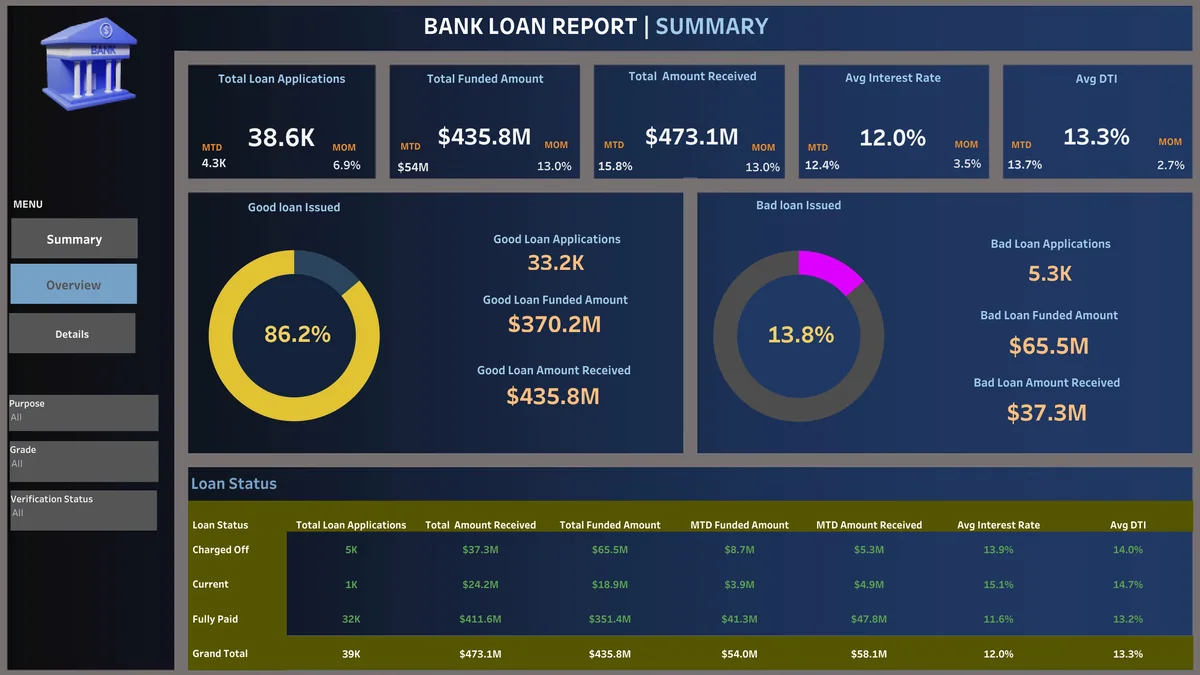
Bank loan summary dashboard in Tableau, with applications, funded amount and good and bad loan splits

Tools MS SQL Server, Tableau

Electric vehicle population analysis

Personal project.

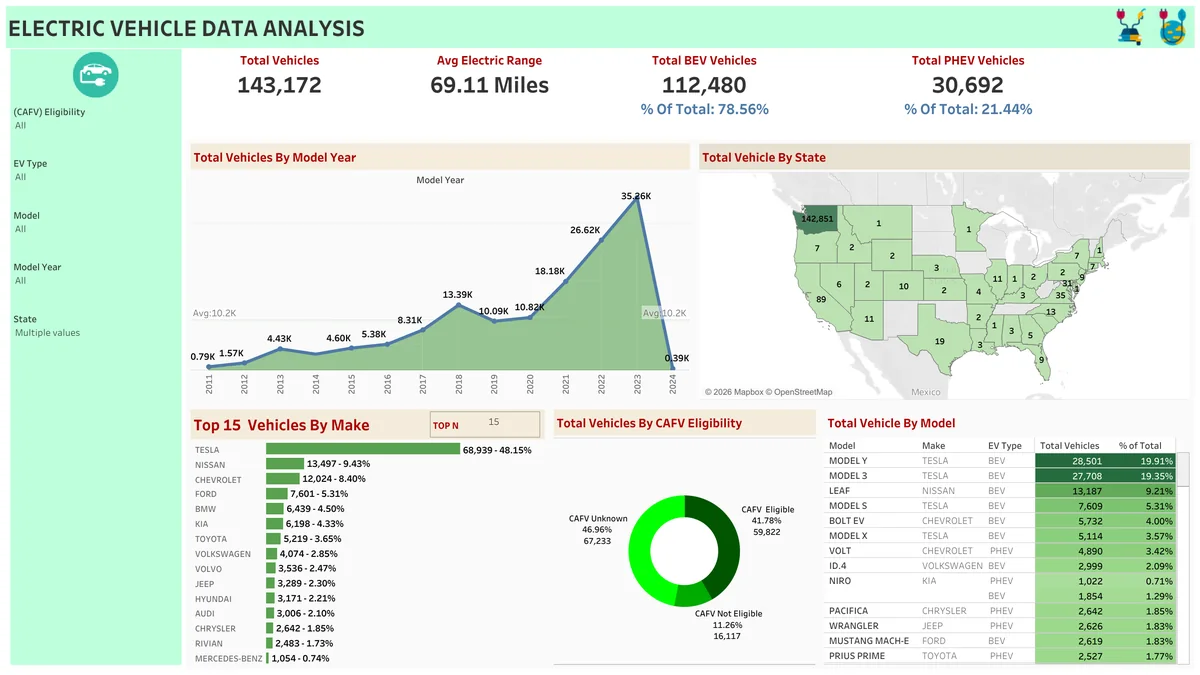
An analysis of electric vehicle registrations in Washington State, covering both battery and plug in hybrid vehicles. I cleaned and explored the data in Python to find the leading manufacturers, where registrations cluster geographically and how battery vehicle adoption has moved year on year, then built a Tableau dashboard aimed at a non technical audience with county distribution, driving range by brand and eligibility breakdowns.

Electric vehicle dashboard in Tableau, with registrations by model year, state, make and eligibility

Tools Python, pandas, matplotlib, seaborn, Tableau

Company bankruptcy prediction

Personal project, using the UCI Polish companies dataset.

A classification problem with a heavy imbalance: five yearly snapshots, 64 financial ratios, and very few insolvent companies to learn from. I handled the imbalance with SMOTE and cost sensitive learning, then compared logistic regression, random forest and gradient boosting. Recall and ROC AUC mattered more than plain accuracy here, since missing a company that goes under is far more expensive than a false alarm. The feature importances lined up with the liquidity and leverage ratios you would expect.

Tools Python, scikit-learn, imbalanced-learn

Australian beach and water locations

University project (COS60008), completed.

An analysis of beach and water locations around Australia using open data. I combined several datasets covering beach amenities and regional climate, worked through the missing values and inconsistent labels, and compared New South Wales against the rest of the country. The whole thing is written up as a Jupyter notebook with a data dictionary so the steps can be followed and rerun.

Tools Python, pandas, Jupyter, open data

Tableau practice dashboards

Personal projects, built for practice.

Two dashboards built to get the basics right. The HR dashboard covers headcount, attrition, demographics and departments, organised around the questions that get asked first: who is leaving, from where, and whether there is a pattern in it. The sales dashboard tracks sales, profit and quantity year on year by category and region, with headline numbers on top, supporting charts underneath and filters that behave the way people expect.

Tools Tableau

EchoSphere

University project.

A full-stack PHP and MySQL store with server-side validation and an order dashboard.

Tools PHP, MySQL

Get in touch

Email is quickest. I usually reply the same day.

vikrambhattarai1994@gmail.com
Location
Melbourne, Victoria. Open to onsite, hybrid and remote.
Working rights
Australian permanent resident. Full working rights, no sponsorship required.
Availability
Available now, full-time or part-time.